
Figure 1.
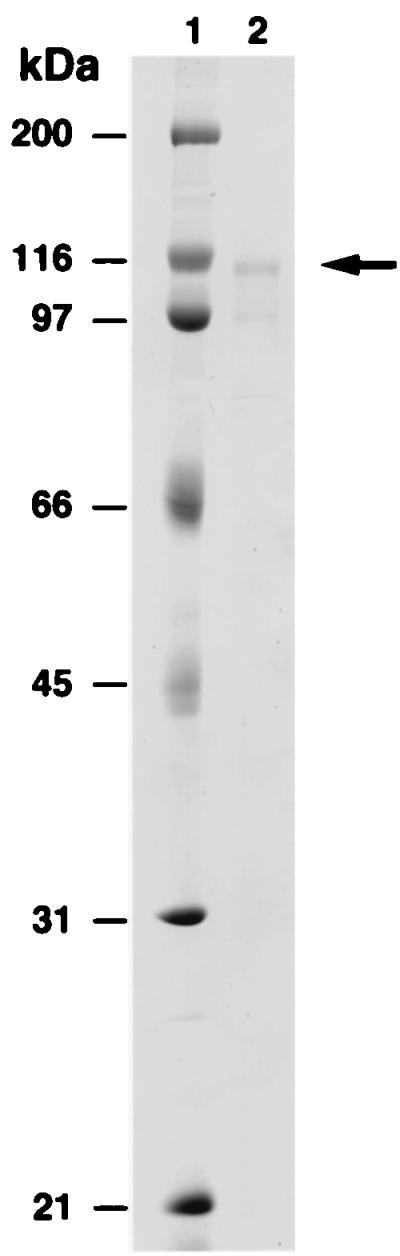
Purified GST-hDinB1 protein. Lane 1, molecular weight markers and lane 2, 100 ng hDinB1 protein. The arrow on the right indicates the position of the full-length GST-hDinB1 protein. The lower band is a degradation product of this protein.
Official websites use .gov
A
.gov website belongs to an official
government organization in the United States.
Secure .gov websites use HTTPS
A lock (
) or https:// means you've safely
connected to the .gov website. Share sensitive
information only on official, secure websites.
Purified GST-hDinB1 protein. Lane 1, molecular weight markers and lane 2, 100 ng hDinB1 protein. The arrow on the right indicates the position of the full-length GST-hDinB1 protein. The lower band is a degradation product of this protein.