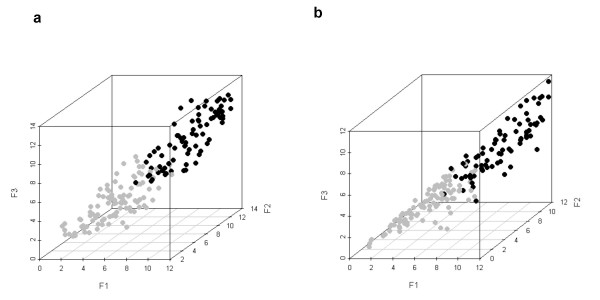
Figure 2.
Separation between NF-κB-regulated (black circles) and non-regulated (gray circles) genes in the pre-processed calibration sample. (a) The axis of the 3D plot represents the first top scores of the matrices M00054 (F1), M00194 (F2), and M00228 (F3) corresponding to the upstream sequences of the calibration sample after an iterative LDA. (b) The three top matching scores of the matrix M00054 are represented for each gene. F1: first score; F2: second score; F3: third score.

