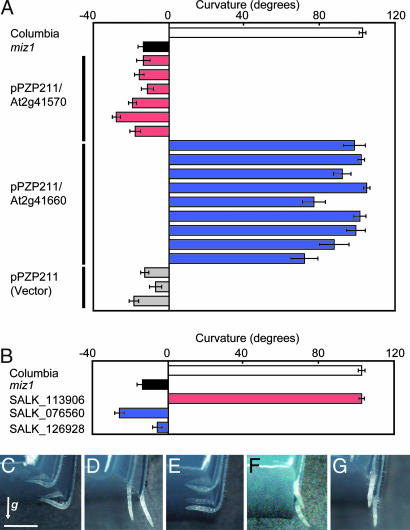
Fig. 4.
Complementation test for hydrotropism in miz1 plants with an introduced At2g41570 or At2g41660 gene and hydrotropic response of the T-DNA insertion lines. (A) Complementation of miz1 by introduction of the At2g41570 or At2g41660 gene. Each bar shows curvature of independently generated transgenic plants. (B–G) Hydrotropic curvature of WT (Columbia) (C), miz1 (D), SALK_113906 (At2g41570) (E), SALK_076560 (At2g41660) (F), SALK_126928 (At2g41660) (G), and the mean values (B) at 12 h after hydrotropic stimulation was initiated. (Scale bar: 1 mm.) The arrow (g) indicates the direction of gravitational force. (A and B) Data are means of at least 25 individuals whose curvature was measured 12 h after the start of hydrotropic stimulation. Error bars represent SE.

