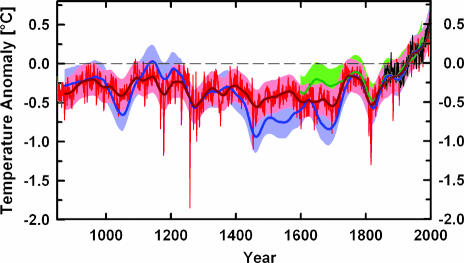
Fig. 2.
Global average surface temperature (50-year Gaussian weighted average) simulated with the NCAR CSM 1.4 with prescribed high (blue), medium (red) and low (green) solar forcing. Annual data are shown for the medium solar forcing run (red, thin line) and for the instrumental record of global average surface temperature (ref. 50, black). Volcanic, greenhouse gas, and tropospheric sulfate forcing are the same in all three simulations. Shaded ranges depict two positive and negative standard deviations around the 50-year averages computed from 1,000 years of an unforced control simulation (SD = 0.107°C).

