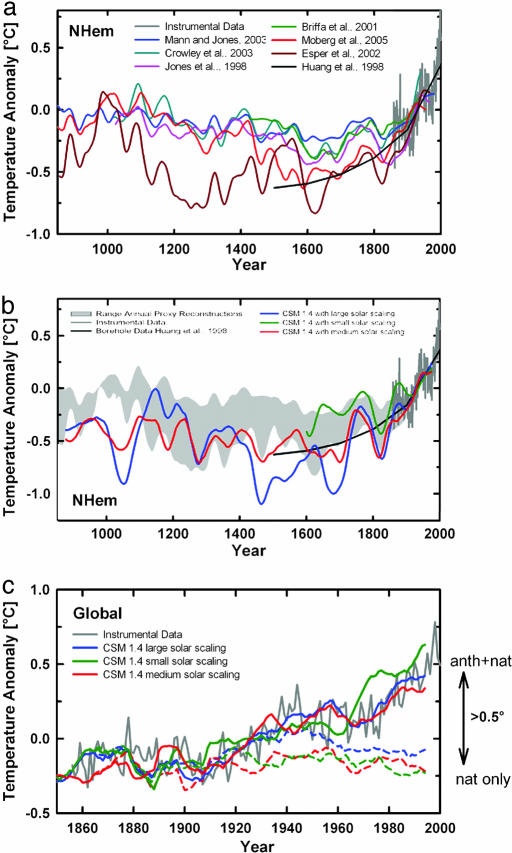
Fig. 3.
Comparison of NCAR CSM simulations with proxy reconstructions and instrumental data. (a) Reconstructed NH average surface temperature anomalies over the past millennium (5–9, 51, 52). All series are as published originally and no additional scaling has been performed, but annual records have been smoothed with a 50-year-long Gaussian filter. All series are relative to 1901–1960 averages computed from original data. The instrumental series is from ref. 50 (dark gray). (b) Northern hemisphere surface temperature from the low- (green), medium- (red), and high-scaled (blue) solar forcing simulations compared with the range spanned by the annual proxy-based reconstructions (refs. 5, 7–9, 52, and 53; gray shaded area). This range does not include a systematic error analysis, it only illustrates the current debate regarding the amplitude of hemispheric multidecadal to century-scale temperature variations of the past. The smooth borehole-based estimate from ref. 54 is shown by the solid black line. Instrumental series, reference period, and filter as in a. (c) Simulated versus the instrumental (gray) record of global average surface temperature (gray, thick solid line). The time series of the low (green), medium (red), and high (blue) solar forcing experiments were smoothed by using an 11-year Gaussian filter. Anthropogenic forcings were included in the primary experiments (solid lines) but held at 1870 AD conditions in 1870–2000 AD branch experiments (dashed lines).

