
Fig. 2.
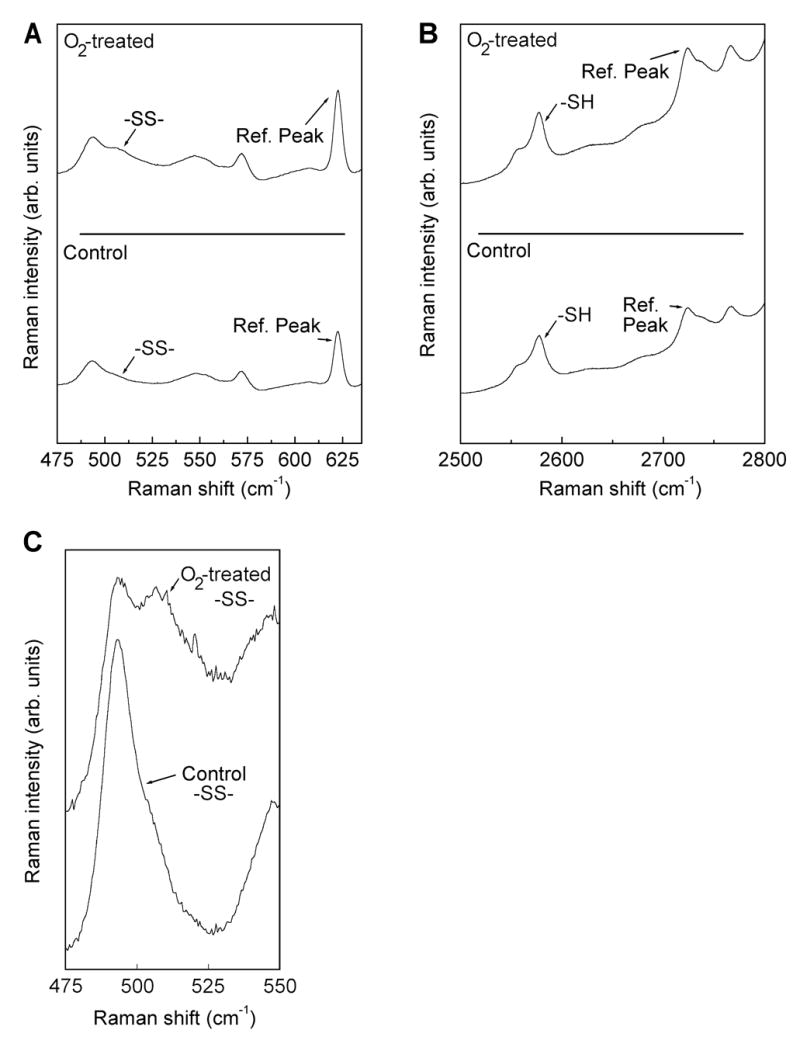
Raman spectra for the guinea pig lens nucleus of the -SS- (A) and -SH (B) regions, with reference peaks, for one control animal plus one animal treated 85 times with hyperbaric oxygen. An enlargement of the -SS- region for control and 85 treatments is also shown (C).