FIG. 5.

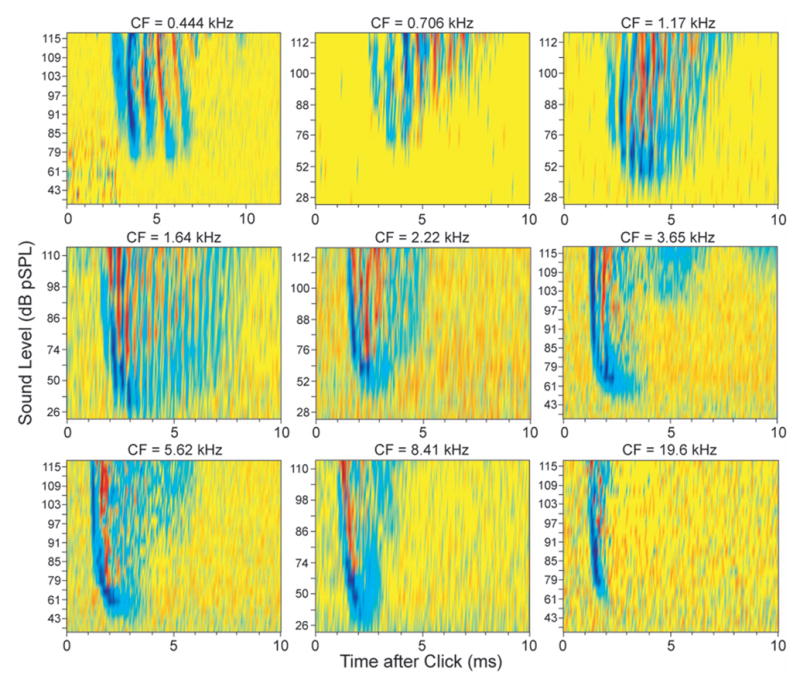
MOC effects on click responses from nine AN fibers spanning a wide range of CFs. Color-coded response plots as in Fig. 4 with purple-blue showing inhibition and red-orange showing enhancement.

MOC effects on click responses from nine AN fibers spanning a wide range of CFs. Color-coded response plots as in Fig. 4 with purple-blue showing inhibition and red-orange showing enhancement.