
FIG. 6.
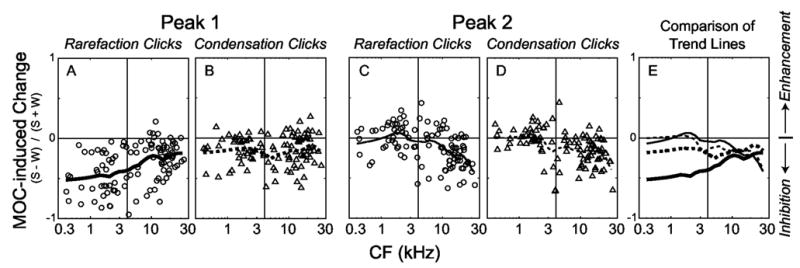
MOC-induced changes in the first and second click-response peaks. Panels A–D: Each symbol shows the change from an individual fiber; panel E: Comparison of MOC-induced changes on different peaks using the Loess-fit curves from A–D. “MOC-induced change” is the rpPST peak amplitude with MOC shocks, S, minus the rpPST peak amplitude without shocks, W, normalized by their sum, S+W. For each fiber, rarefaction and condensation responses were considered separately, the response was segmented into peaks, responses from levels 75–100 dB pSPL were averaged, the average number of spikes in each peak was computed, and the MOC-induced change was calculated from these averages. Points from 104 fibers from 10 cats. The lines are Loess-fit (Cleveland, 1993) curves to the data that show trends across frequency. The vertical lines mark 4 kHz, below which individual peaks were readily discernable.