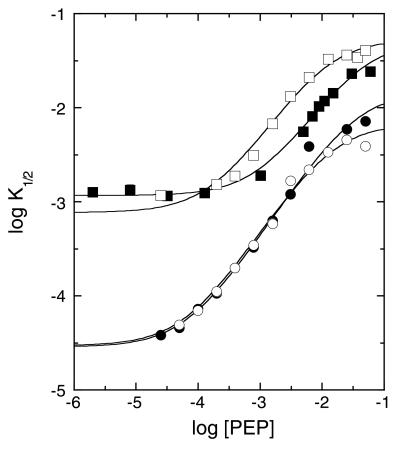
Figure 2.
Dependence of the apparent K1/2 for Fru-6-P on increasing concentrations of the inhibitor PEP for wild type (●) and E161A (○), R162A (■), and E161A/R162A (□) mutants of BsPFK. K1/2 values were obtained from substrate saturation profiles such as those shown in Fig. 1. Curves correspond to the best fit of these data to Eq. 3 described in the text.

