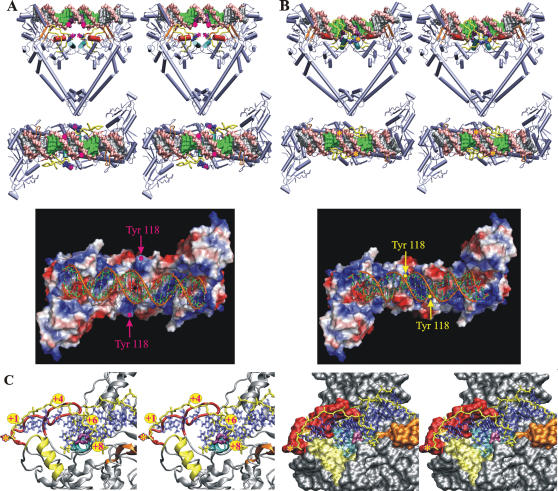
Figure 5.
DNA binding, recognition and cleavage by S. pneumoniae ParC. Initial (A) and final (B) stages of DNA binding and recognition are modeled and shown as orthogonal stereo representations of the protein-DNA complex (top) together with the electrostatic surface potential of the DNA binding groove (bottom). The ParC dimer is shown in cartoon mode; the helix α4 is in red, the helix α3 in cyan, the 100-122 loop in yellow and Gly 166 - Pro 179 domain in orange. The active-site tyrosines are shown in blue color using CPK mode and indicated by asterisks (magenta for unbound and yellow for bound to the DNA states). The target 5′-end phosphates of the DNA molecule are indicated by circles in magenta. The DNA molecule is represented as a molecular surface model; the backbone is in pink, the cleavage points in purple, the base pairs involved in sequence specific recognition in green and non-specific base pairs in silver. (C) Stereo view of the active site of the modelled protein-DNA complex of S. pneumoniae ParC after cleavage and separation of the DNA fragments in cartoon (left) and surface (right) representation. Topo IV cleaves DNA with a 4-base stagger and the active site tyrosines are covalently attached to the 5′-ends of the DNA. Ser 79 and Asp 83 which upon mutation lead to quinolone resistance in bacteria are shown in purple, the helix α4 is in cyan, the helix α3 in yellow, the 100-122 loop with active site tyrosine in red and Gly 166-Pro 179 domain in orange. DNA molecule backbone is shown in yellow and side chains are in blue. The position of the covalent bond between the active-site tyrosine and the target 5′-end DNA backbone phosphate is indicated by a yellow asterisk in a magenta circle. Panels were rendered using VMD [50], Pov-Ray and PyMOL [53].

