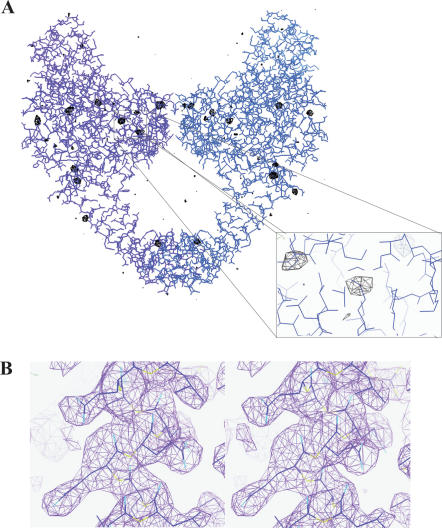
Figure 6.
Electron density maps confirming the molecular replacement solution. (A) Superposition of the anomalous difference Fourier map calculated using Cys426 data collected on the chromium edge contoured at 3.5σ with the final refined model of ParC55. Panels were rendered using Coot [46]. (B) Stereo view of a region of the 2Fobs-Fcalc electron density map from wild-type ParC55 data contoured at 1.5σ with the final refined model superimposed.

