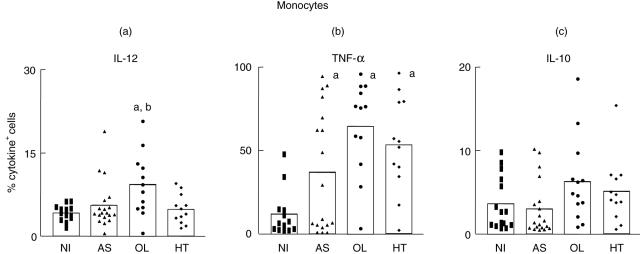
Fig. 2.
Intracellular cytokine profile of circulating monocytes in peripheral blood from non-infected (NI) (▪ = 13), asymptomatic (AS) ▴ = 19), oligosymptomatic (OL) (• = 12) and HAM/TSP (HT) (♦ = 12) individuals after short-term in vitro incubation, particularly in the absence of exogenous stimuli. A double-staining immunophenotyping platform was used to identify cytokine-positive cells within monocytes selected as SSClow CD14high+ leucocytes. The results are expressed as scattering of individual values and mean percentage of interleukin (IL)-12+ (a), tumour necrosis factor (TNF)-α+ (b) and IL-10+ (c) monocytes. Letters ‘a’ and ‘b’ represent statistically significant differences (P < 0·05) compared to NI and AS groups, respectively.

