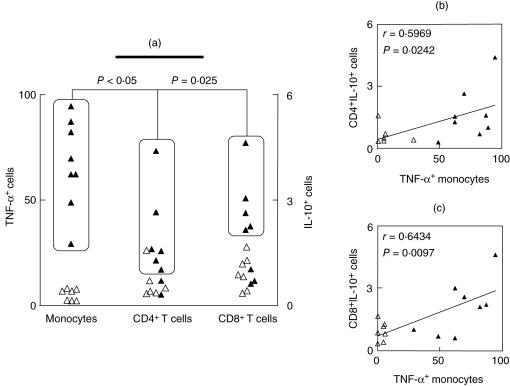
Fig. 3.
Analysis of major discriminatory immunophenotypes of asymptomatic (AS) individuals: (a) Analysis of individual data demonstrates an association between high frequency of tumour necrosis factor (TNF)-α+ monocytes with high frequency of CD4+ IL-10+ and CD8+ IL-10+ T cells in AS (▴). The boxed regions represent subgroups of patients, highlighting the association between the individuals displaying high levels of TNF-α+ monocytes as well as IL-10+ CD4+ and IL-10+ CD8+ lymphocytes. Analysis of individual data demonstrates an association (dotted rectangles and lines) between the low frequency of TNF-α+ monocytes with low frequency of CD4+ IL-10+ and CD8+ IL-10+ T cells in AS (▵). χ2 analysis demonstrated that the associations are significant and the P-values are shown in the figure. (b, c) Confirmatory correlation analysis validates the association between TNF-α+ monocytes with the frequency of CD4+ IL-10+ and CD8+ IL-10+ T cells. Correlation indexes (r and P-values) are shown in the figure.

