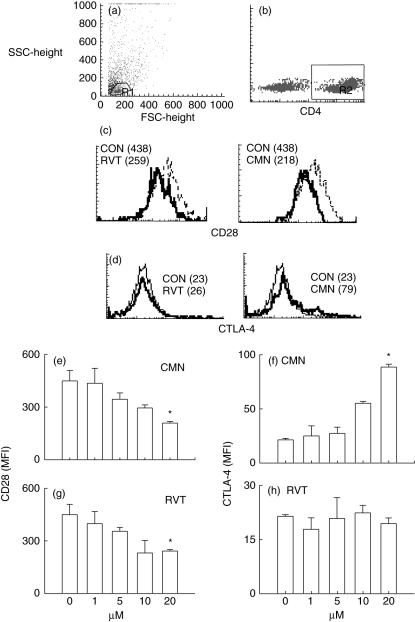
Fig. 7.
Effect of resveratrol (RVT) and curcumin (CMN) on the expression of CD28 and CTLA-4. RVT and CMN were added in different concentrations (1,5, 10, 20 μM) to concanavalin A (ConA)-stimulated lymphocytes and the expression of CD28 and CTLA-4 was monitored on CD4+ T cells using phycoerythrin (PE)-labelled anti-CD4+ antibodies, cychrome (Cy)-labelled anti-CD28 and fluorescein isothiocyanate (FITC)-labelled anti-CTLA-4 antibodies. The expression was analysed by flowcytometer. The histograms indicate gated (R1) population of lymphocytes (a), gated (R2) population of CD4 cells (b), expression of CD28 (c) and CTLA-4 (d) on CD4+ T cells cultured with ConA (dotted line) and 20 μM of RVT and CMN (solid lines). The data shown in parentheses depict mean fluorescence intensity (MFI). The CD28 and CTLA-4 data shown as bar diagrams are expressed as the MFI (mean ± standard error (s. e.) of the cells cultured with different doses (1–20 μM) of RVT and CMN (e–h). The data shown are from triplicate determinants. *P < 0·05 compared to ConA-treated cells.

