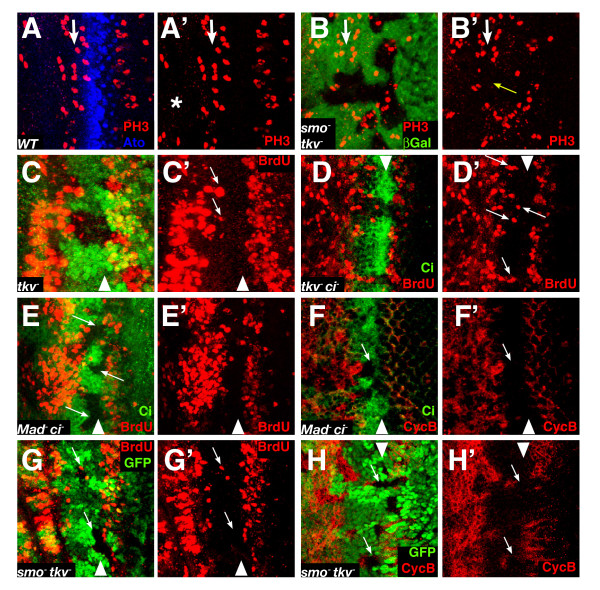
Figure 3.
Dpp and Hh control G1 arrest primarily in the anterior of the NPR. (A) WT eye disc showing the cells in mitosis as marked by phosphohistone H3 antibody (PH3, in red) and the Ato pattern of expression (blue). The white arrow marks the line of synchronized mitosis anterior to the NPR in A and B. In the region anterior to this line the frequency of phosphohistone H3 positive cells is very low (asterisk) (B) Eye disc with a large smo3 tkva12 M+ clone (absence of green). The yellow arrow marks the region where the distinct line of mitosis (pH3, red; the so-called first mitotic wave) is lost. (C) tkva12 clones (absence of green) showing some BrdU positive cells (red) in the anterior part but not in the posterior (arrows). (D) Similarly, in tkva12 ci94 clones (marked by the absence of Ci antibody in green) there are no BrdU positive cells in the posterior region of the NPR (red). The arrows mark some BrdU cells in the anterior part of the NPR. (E-F) Mad12 ci94 clones (marked by absence of Ci, green) stained for BrdU (E) and CycB (F) in red. The arrows mark clones in the posterior part of the NPR where there is no ectopic BrdU incorporation or CycB accumulation. (G) smo3 tkva12 clones (arrows) marked by absence of β-gal, in green (arrows). The picture shows a representative clone in the lower part of the panel with no ectopic BrdU positive cells (red) (H) Ectopic CycB (red) accumulates only in the anterior region of the NPR in smo3 tkva12 clones (absence of green). This is highlighted in clones that span the whole NPR, where there is clear CycB accumulation that does not reach the most posterior cells (arrows).

