
Figure 8.
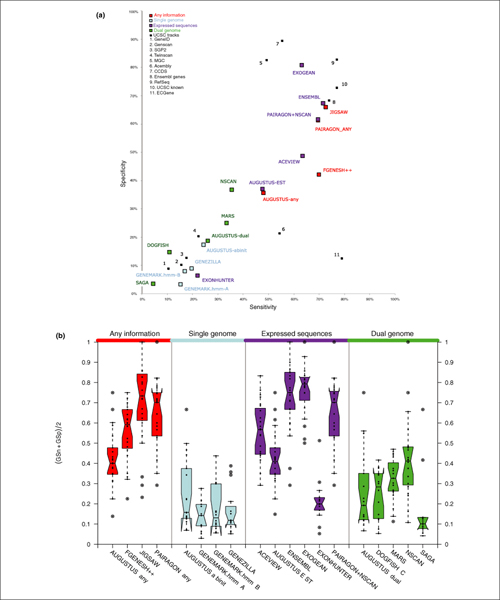
Gene Prediction Accuracy at the gene level: Sensitivity versus specificity. Top panel: dotplot for sensitivity versus specificity at the gene level for CDS evaluation. Each dot represents the overall value for each program on the 31 test sequences. Bottom panel: boxplots of the average sensitivity and specificity for each program. Each dot corresponds to the average in each of the test sequences for which GENCODE annotation existed.