
Figure 4.
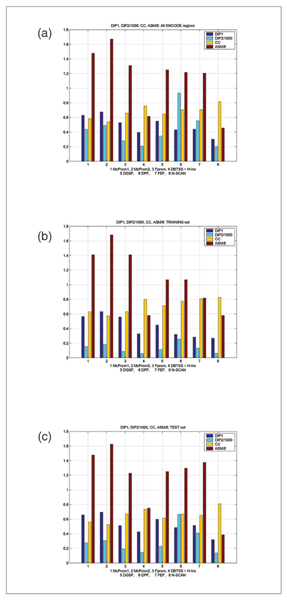
Another set of results for ENCODE regions. The results presented are for the maximum allowed distance of 1,000 nucleotides between the predicted TSS and the reference one. DIP1 and DIP2 are two measures of prediction qualities expressed as distances from the ideal predictor [10]. CC is the Pearson correlation coefficient. ASM is the average score measure as defined in [10]. DIP2 and ASM are scaled down to fit into the graph. Results are presented for all ENCODE regions, for the training set and for the test set. Relation of scores to the predictor performance is as follows: for distances from the ideal predictor (DIP1 and DIP2), as well as for ASM, the lower the score, the better. ASM represents the averaged rank position of the predictor calculated based on the individual measures of success. For CC, the greater the score, the better. CC ranges from -1 to +1.