
Figure 2.
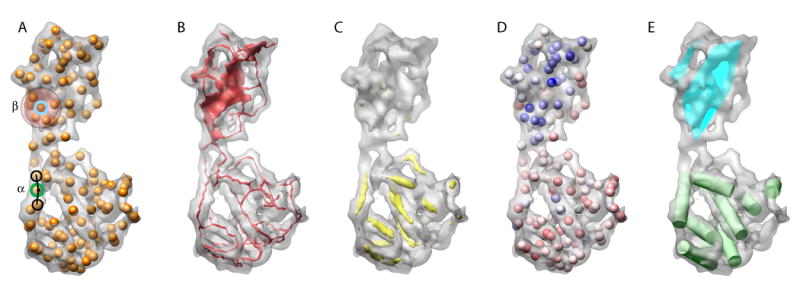
Data representation in SSEhunter. During the identification of secondary structure elements, pseudoatoms are first generated to approximate the density distribution of the density map. The pseudoatom representation for the 8Å resolution simulated density map of 2BTV VP7 is shown in (A). These pseudoatoms are subsequently scored using several metrics based on their local environment. As examples, a pseudoatom in an α-helix (green, α) and its two closest neighboring pseudoatoms form nearly a straight line, while β-sheets contains multiple pseudoatoms with similar distances to each other (cyan, β). Skeletonization of the density then occurs and is shown in (B). The results of cross-correlation with a prototypical α-helix are shown in (C). Finally, the scores from skeletonization, cross-correlation and local geometry predicates are mapped back to individual pseudoatoms and colored based on their propensity to be α-helical (red) or β-sheet (blue) (D). The final annotation of VP7 is shown in (E), where α-helices are represented as green cylinders and β-sheets are shown as cyan planes.