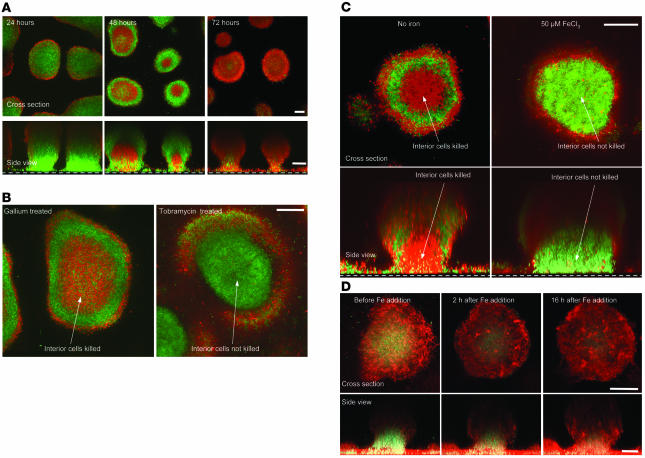
Figure 4. Ga kills established biofilms.
(A) Biofilms were grown using GFP-labeled P. aeruginosa for 3 days in the absence of Ga; treated with 100 μM Ga(NO3)3 for the indicated time periods; and stained with 30 μM propidium iodide, which labels dead cells red. Top images are top-down views (x-y plane); bottom images are side views (x-z plane); the dotted line represents the biofilm growth surface; scale bars: 50 μm. Results are representative of 4 separate experiments. (B) High-magnification image of the biofilm killing pattern of Ga and tobramycin. Three-day-old P. aeruginosa biofilms (grown without Ga) were treated with Ga(NO3)3 (100 μM) or tobramycin (1 μg/ml) for 48 hours and stained as described in A. Ga preferentially killed bacteria in the central regions, whereas tobramycin preferentially killed bacteria located in the biofilm periphery. Images are top-down views (x-y plane); scale bar: 50 μm. Results are representative of 3 separate experiments. (C) Fe addition eliminates the central biofilm killing pattern of Ga. GFP-labeled P. aeruginosa biofilms were grown in flow cells for 3 days with or without FeCl3 (50 μM), treated with 100 μM Ga(NO3)3 for 48 hours, and then stained as described in A. Fe addition eliminated the central killing pattern of Ga. Top images are top-down views (x-y plane); bottom images are side views (x-z plane); the dotted line represents the biofilm growth surface; scale bar: 50 μm. Results are representative of 3 separate experiments. (D) Evidence for Fe starvation in the central biofilm regions. P. aeruginosa constitutively expressing red florescent protein and containing the pvdA-gfp(S) reporter (which fluoresces green during Fe limitation; see Supplemental Figure 4) were grown in biofilms for 3 days. In the absence of added Fe, the central biofilm regions appeared green, indicating Fe limitation. Fe addition reduced the size of the central Fe-starved (green) region within 2 hours. Images are top-down views (x-y plane); scale bar: 50 μm. All images in D were taken with identical confocal microscope settings, and results are representative of 3 separate experiments.

