
Figure 1.
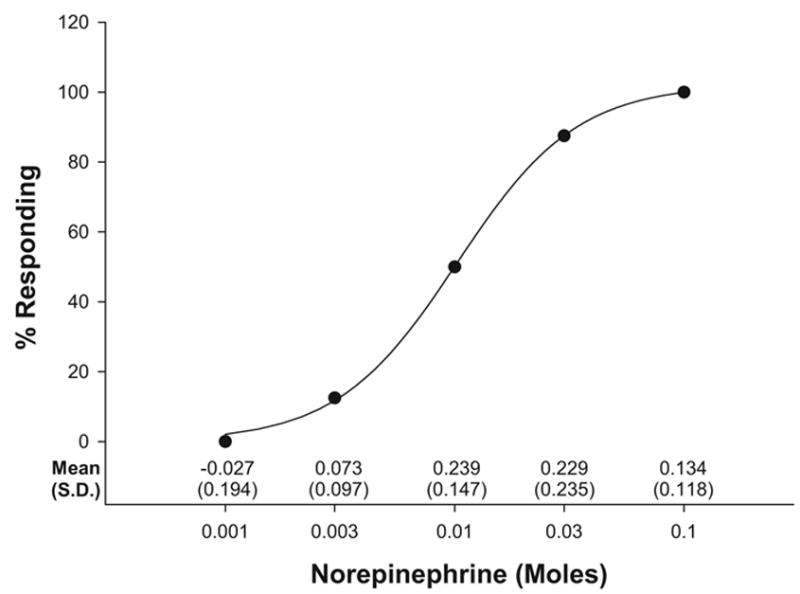
Cumulative percentage of embryos showing a ≥.2 proportion beat-per-minute increase from baseline 2 hr after injection. Solid circles represent actual cumulative percentage data and are fit with a logistic regression line. Proportion change from baseline means and standard deviations for each of the norepinephrine concentrations are shown along the abscissa.