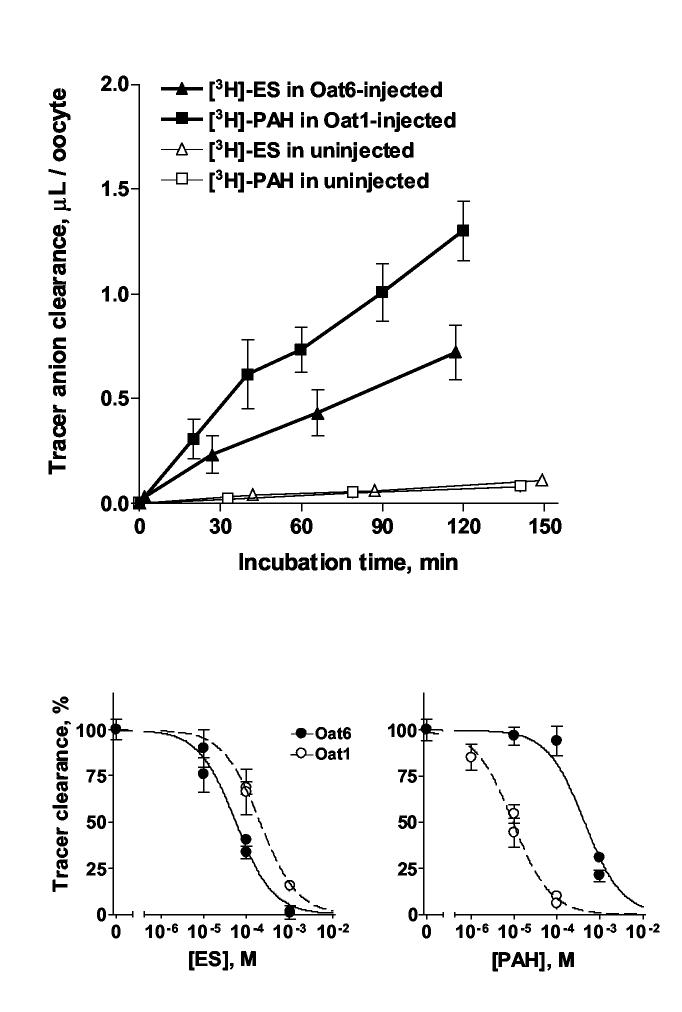
Figure 3.
(A) Time course of the accumulation of [3H]-ES in Oat6-injected oocytes, of [3H]-PAH in Oat1-injected oocytes, and of both [3H]-labeled tracers in uninjected oocytes. Each data point represents Mean ± SE of triplicate samples. (B) Concentration-dependent inhibition of the clearance of tracer substrate ([3H]-ES in Oat6-injected oocytes or [3H]-PAH in Oat1-injected oocytes) by ‘cold’ (unlabeled) ES and PAH. Each data point represents Mean ± SE of quadruplicate samples. Best-fit curves and IC50 values were calculated using GraphPad Prism software.

