Figure 4.
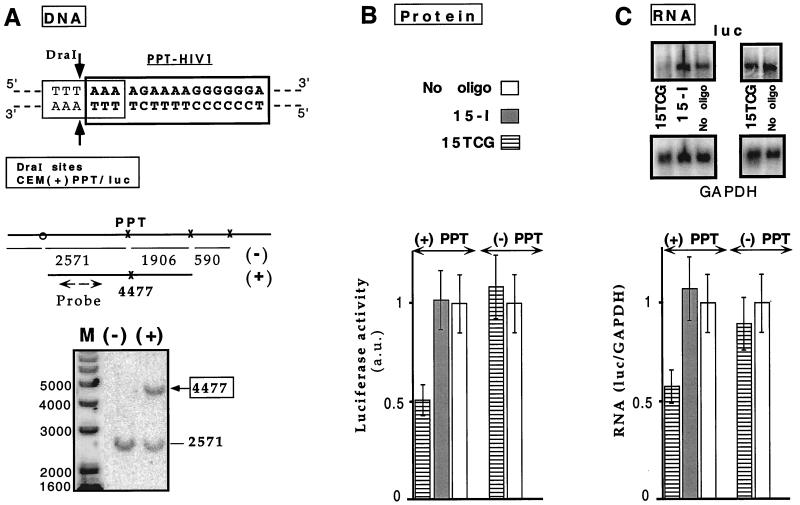
Triplex inhibition of transcription elongation of an endogenous gene. (A) Target accessibility: DraI protection assay. (Upper) The PPT oligopyri-midine⋅oligopurine sequence (in bold type) overlaps DraI restriction site (thin line). The two arrows indicate the cleavage sites by the enzyme. DraI and AscI sites around the triplex formation site are indicated with x or o, respectively. AscI cleavage is used because no DraI site is present between the 5′ end of the PPT site and the integration site on the retroviral vector. The lengths of the fragments obtained after complete digestion are displayed. Specific triplex formation on the PPT site is revealed by the appearance of a longer fragment of 4,477 bp because of inhibition of DraI cleavage at the PPT site. The probe hybridization site is shown by a broken line. (Lower) An oligonucleotide psoralen conjugate (Pso-15TCG) was used as a probe for accessibility of the PPT target in the CEM(+)PPT/luc cell line. Cell nuclei were incubated in the presence [lane (+)] or in the absence [lane (−)] of Pso-15TCG and irradiated. DNA was extracted, digested by DraI and AscI, and analyzed by Southern blotting. Fragment lengths are indicated besides the gel. Lane M: DNA marker (1-kb marker, GIBCO/BRL). (B and C) Two cell lines expressing firefly luciferase reporter gene and that differ from each other only by the presence or the absence of a 34-bp insert containing the wild-type PPT sequence [CEM(+)PPT/luc and CEM(−)PPT/luc, respectively] were reversibly permeabilized with SLO in the absence (−) (empty bars) or presence of 15TCG or 15-I (referring to either 15-I1 or 15-I2 olignucleotides that exhibited equivalent effect). (B) Protein analysis. Luciferase activity per living cell was measured 24 h after oligonucleotide delivery (see Materials and Methods). Normalized values with respect to the SLO-treated cells in the absence of oligonucleotides are reported [luciferase activity in arbitrary units (a.u.)]. (C) RNA analysis. (Upper) Northern blots of total RNA extracted 24 h after oligonucleotide introduction were hybridized with luc and GAPDH probes (Left: CEM(+)PPT/luc cells; Right: CEM(−)PPT/luc cells). (Lower) Bar graph shows relative abundance of luc transcript compared with GAPDH mRNA (luc/GAPDH), normalized with the value obtained in the absence of oligonucleotide.

