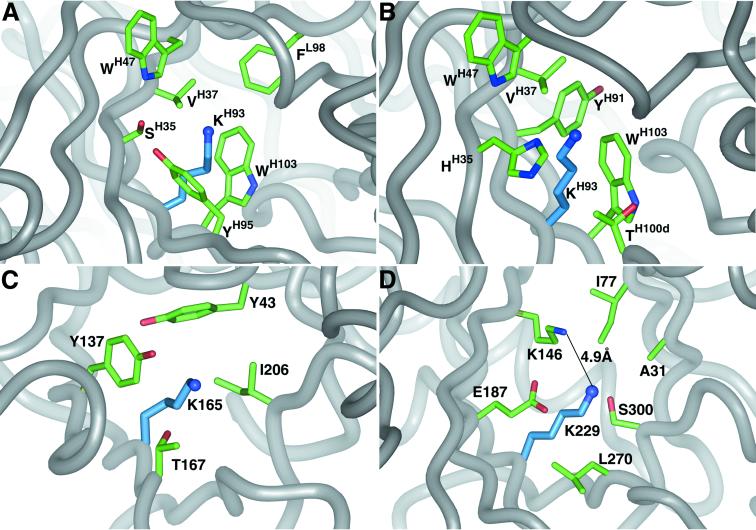
Figure 4.
Comparison of aldolase abzyme and enzyme active sites. All of the labeled side chains are within 5 Å of the catalytic lysine (blue) Nɛ group. (A) Top view of the Fab′ 33F12 combining site. (B) Same view for the homology model of 40F12. (C) View of the N-acetylneuraminate lyase active site (17) around the Nɛ of the catalytic lysine residue 165. (D) Same view of fructose 1,6- bisphosphate aldolase active site (19) around the Nɛ of the catalytic lysine residue 229. The figure was generated with insight (Biosym Technologies).

