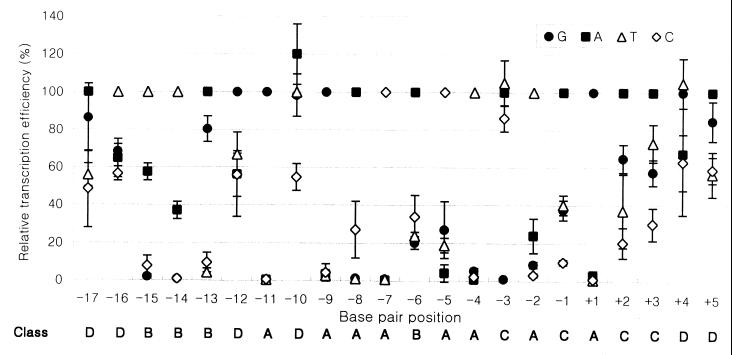
Figure 4.
Relative in vitro transcription efficiencies of SP6 promoter variants compared with consensus SP6 promoter. Each position was classified as described in the text, and the classifications (classes A to D) are shown at the bottom. An average of more than three measurements was taken for each variant.

