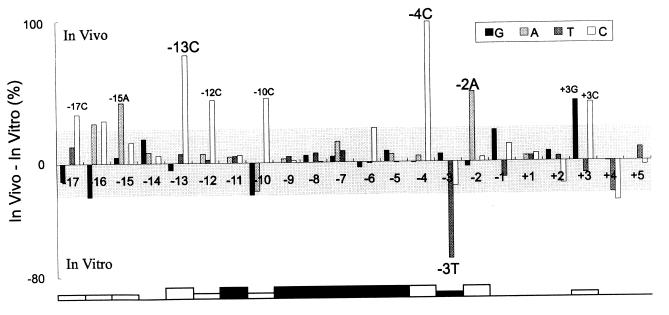
Figure 5.
Difference between in vivo and in vitro activities of the promoter variants. Each bar results from subtracting the in vitro activity from the in vivo activity, separately expressed as the percentage of the consensus promoter activity. Differences shown in the shaded area are within experimental error. Residues possibly involved in polymerase binding (filled boxes) and those displaying high in vivo:in vitro activity ratios (open boxes) are highlighted at the bottom.

