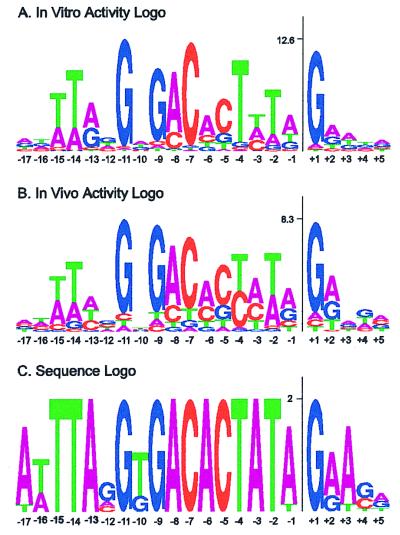
Figure 6.
Activity and sequence logos of the phage SP6 promoter. The two activity logos were constructed based on energetic contribution of each base pair in every position to the promoter activity as described in the text. Maximum heights of the activity logos simply reflect lower limits of measurements. The maximum information content in each residue is 2 in sequence logos. The sequence logos were generated from 11 known SP6 promoter sequences (1) by http://www.bio.cam.ac.uk/seqlogo/logo.cgi (15).

