Figure 3.
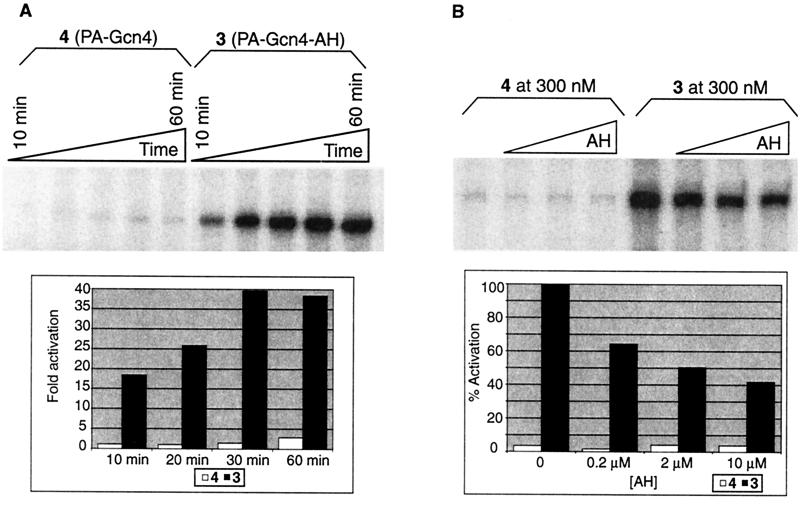
Dependence of activation level upon time and activating region. (A) (Upper) Storage phosphor autoradiogram showing an in vitro transcription time course experiment with conjugates 3 and 4 present at 300 nM concentration. Aliquots were processed at 10, 20, 30, 40, and 60 min. (Lower) Comparison of the amount of transcript obtained at each time point relative to basal transcription levels in which no conjugate was present (fold activation). (B) (Upper) Storage phosphor autoradiogram showing the effect of increasing concentrations of untethered 21-aa AH peptide on transcription reactions containing either conjugates 4 or 3 at 300 nM concentration. Transcription reactions were performed for 30 min in the presence of 0, 0.2 μM, 2 μM, and 10 μM concentrations of AH peptide. (Lower) For each reaction, the amount of transcript obtained was compared with basal transcription levels to give the respective fold activation value. These values are displayed as percent activation compared with the results from the reaction containing conjugate 3 (lane 5), which is defined as 100%.

