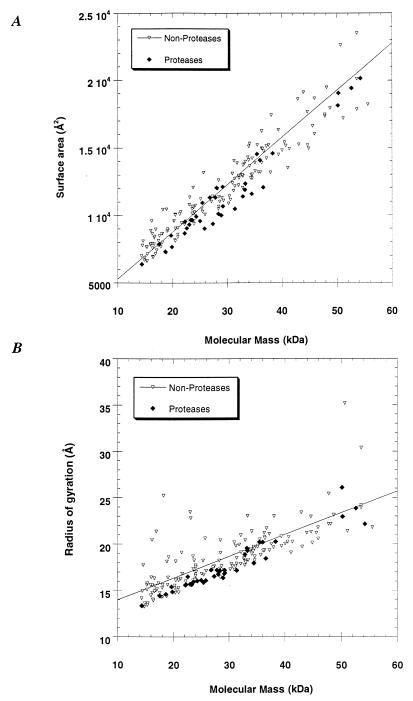
Figure 1.
(A) Molecular mass vs. surface area for proteases (♦) and nonproteases (▿). The linear fit for the nonproteases gives a correlation coefficient (R) of 0.95. The average surface area to molecular mass ratios for the proteases and nonproteases are 0.39 ± 0.03 Å2/Da and 0.43 ± 0.05 Å2/Da, respectively. (B) Radius of gyration versus molecular mass. R (nonproteases) = 0.96.

