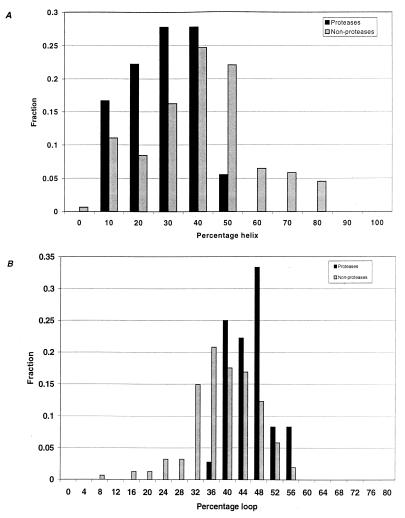
Figure 3.
Secondary structure comparisons between the nonproteases (░⃞) and proteases (■). (A) Percentage helix. The averages are 24.1 ± 11.4 (proteases) and 36.0 ± 18.3 (nonproteases). (B) Percentage loop. The averages are 44.3 ± 5.1 (proteases) and 37.6 ± 8.0 (nonproteases). Categories are upper limits of bins.

