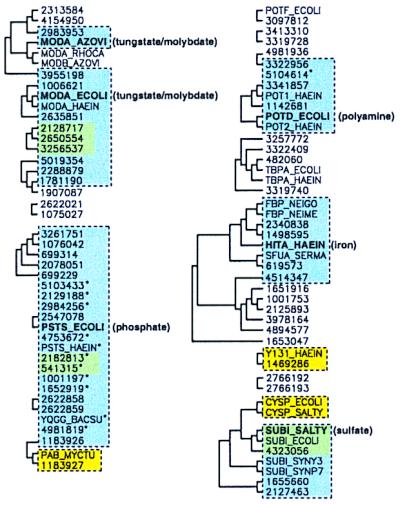
Figure 6.

Comparison of three functional clustering methods for the SubI family of periplasmic binding proteins. Solid black lines designate clusters from the whole-domain phylogenetic tree present in ≥30% of the bootstrap replicates. Phylogenetic clusters from the binding-site subphylogeny (yellow boxes) were considered significant if present in ≥25% of the replicates. A lower value was used for the SubI family because there are fewer contact positions in the alignment. Binding-site matches to the six known structures are shown with blue rectangles (see text), and green shading represents overlap between blue and yellow clusters. Asterisks identify sequences that did not fall into a significant cluster in the whole-domain phylogeny but that match the binding-site residues of a known structure.
