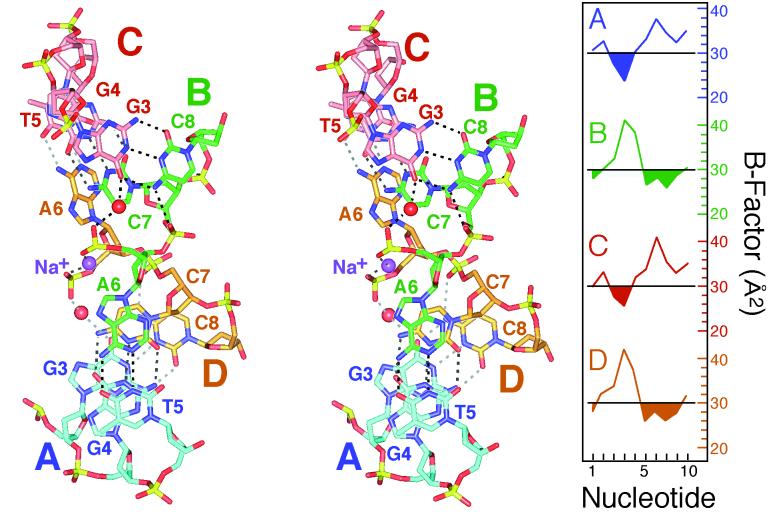
Figure 5.
Structure of the Holliday junction. (Left) Stereoview of the crossover at the junction formed by atoms of the G3⋅C8, G4⋅C7, and T5⋅A6 base pairs from strands A (blue carbons), B (green carbons), C (red carbons), and D (yellow carbons). The stacked base pairs of the A-B and D-A arms on the lower half are shown looking down the helix axis. The N4 nitrogens of nucleotides C8 in strands B and D are hydrogen bonded (dashed lines) to the oxygens of the phosphate linking A6 to C7 at the junction crossover. Waters bridging the O6 keto oxygens of guanine G3 in the A and C stands to the 5′-phosphates of A6 are shown as red spheres, whereas the sodium ion that links the 5′-phosphates of the two A6 nucleotides is indigo. (Right) Plot of the average B-factor (Å2) for each nucleotide along strand A (blue), B (green), C (red), and D (yellow). B-factors that are below 30 Å2 are colored solid. The average B-factor for the DNA model is 32.2 Å2.

