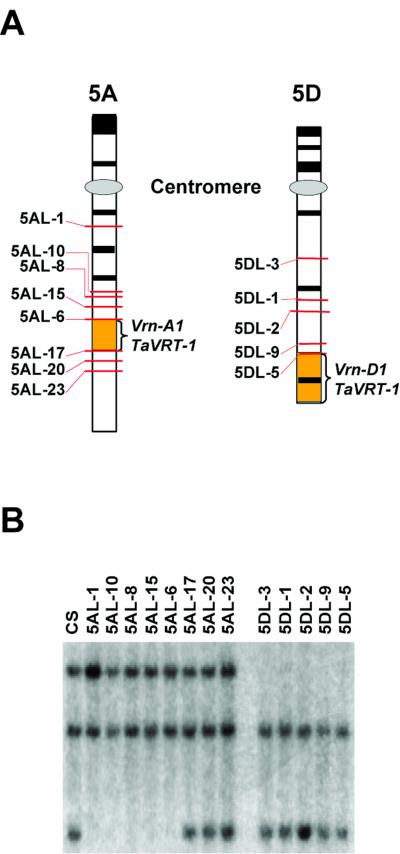
Figure 2.
Mapping of TaVRT-1. a, Schematic representation of the deletion lines used to map the TaVRT-1 gene on chromosomes 5A and 5D. The numbers to the left indicate the deletion breakpoints of each line, where the distal portion of the chromosome is missing. Black boxes represent telomeric C-band markers. Orange boxes indicate the regions containing Vrn-1 and TaVRT-1. b, DNA gel-blot analysis of genomic DNA from wheat cv Chinese Spring (CS) and chromosome 5A and 5D deletion lines.

