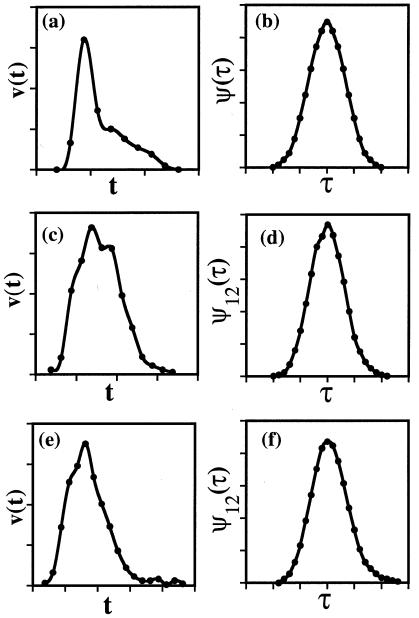
Figure 1.
(a) Density histogram for an ideal protein. (b) Its autocorrelation function. (c) Density histogram for a three-dimensional electron density map, based on phase extension where ϕ(020) = 135° (best solution). (d) Cross-correlation of c with a. (e) Density histogram for incorrect structure generated when ϕ(020) = −135°. (f) Cross-correlation of e with a.

