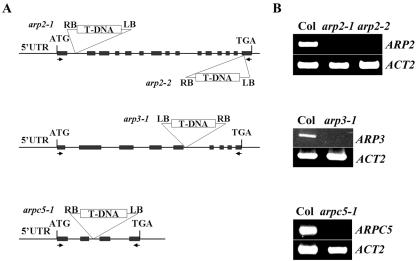
Figure 2.
Characterization of the Arp2/3 subunit mutants. A, The location of the T-DNA insertions in arp2-1, arp2-2, arp3-1, and arpc5-1/p16-1 are shown on the maps of AtARP2, AtARP3, and AtARPC5/p16 genes. Arrows indicate the location of primers used for RT-PCR analysis of transcripts. Exons are boxed and introns and untranscribed flanking sequences are shown as lines. B, RT-PCR analysis of transcript levels for arp2-1, arp2-2, arp3-1, and arpc5/p16-1 mutants. Total RNA was extracted from inflorescences of each homozygous mutant plant and WT plants. The full-length coding sequence was amplified for each primer set.

