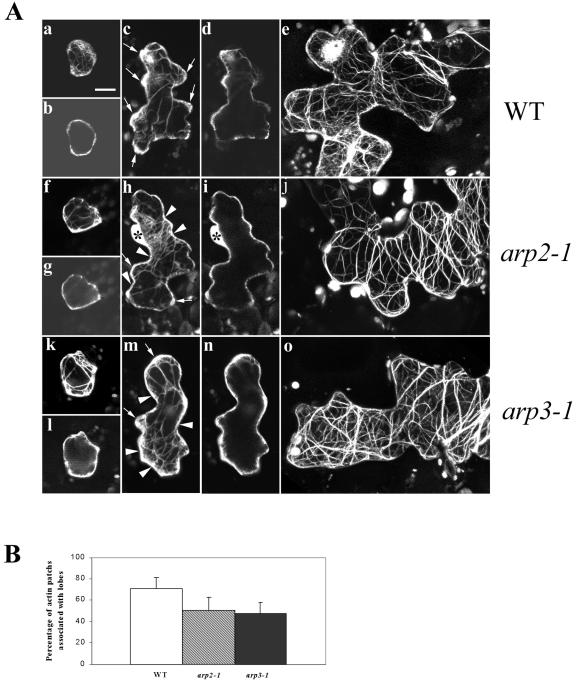
Figure 5.
Analysis of actin organization in leaf pavement cells of arp2-1 and arp3-1 plants. A, F-actin organization in leaf pavement cells from arp2-1 and arp3-1 plants visualized by GFP-mTalin at different developmental stages. Leaves from 10-d-old plants were bombarded with GFP-mTalin construct, and cells expressing GFP-mTalin were imaged using confocal microscopy as described in the text. Pavement cells at three developmental stages are shown: b, g, and k, Stage I cells before lobe initiation; c, h, and m, stage II cells forming lobes; and e, j, and o, stage III cells with fully extended lobes. More than 60 cells were imaged for each stage of cell in every genotype. Shown are cells with representative actin organization. a to e, Leaf pavement cells of WT plants. f to j, Leaf epidermal cells of arp3-1 plants. k to o, Leaf epidermal cells of arp2-1 plants. a, c, e, f, h, j, k, m, and o show three-dimensional images projected from laser scanning. b, d, g, i, l, and n are single medial sections of a, c, f, h, k, and m, respectively. Arrows in c, h, and m point to the diffuse F-actin patches associated with growing lobes. Arrowheads in h and m point to diffuse F-actin associated with neck regions. Asterisks in h and i indicate the nucleus of the cell. Bar = 15 μm for all images. B, Quantitative analysis of association of diffuse cortical F-actin with the tip of expanding lobes in pavement cells. Measurements were done on 30 stage II cells by visual examination. The percentage of strong diffuse cortical F-actin associated with lobes for WT, arp2-1, and arp3-1 pavement cells are 70.83 ± 10.57, 50.22 ± 12.08, and 47.08 ± 10.91, respectively. Statistical analyses (t test) showed that the percentage of strong diffuse F-actin associated with lobes of both mutant pavement cells is significantly reduced (n = 30, P ≤ 0.05).

