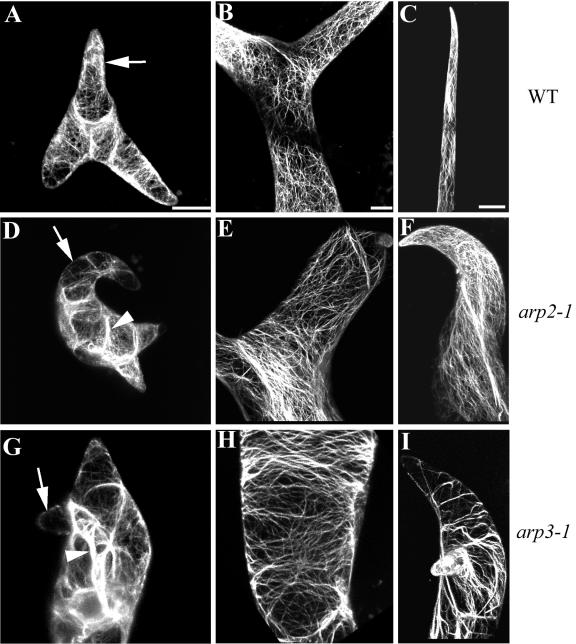
Figure 6.
Actin organization in trichomes of arp3-1 and arp2-1 plants. F-actin was visualized as described in Figure 5. All images shown are projections. Bar in A is for A, D, and G. Bar in B is for B, E, and H. Bar in C is for C, F, and I. Bar = 20 μm. A, D, and G, Young trichomes from a WT, arp2-1, and arp3-1 plants, respectively. Arrow in A points to diffuse cortical F-actin signal in a rapid growing branch. Arrows in D and G indicate the loss of fine F-actin in the mutant branches. Arrowheads in D and G point to thick actin cables. B, E, and H, Stalks of mature trichomes from WT, arp2-1, and arp3-1 plants, respectively. C, F, and I, Branches of mature trichomes from WT, arp2-1, and arp3-1 plant, respectively.

