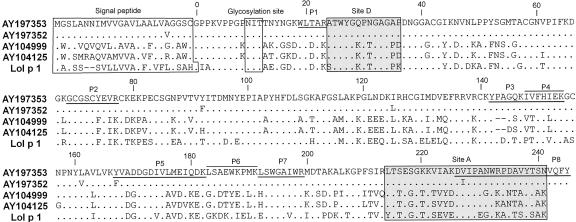
Figure 1.
Protein sequence alignment of Zea m 1 based on four distinctive cDNAs and comparison with Lol p 1 (GenBank accession no. X57678). Predicted proteins are identified by GenBank accession numbers. Dots represent residues that are identical to that of AY197353. Hyphens show gaps to maximize alignment. Boxed annotations include the signal peptide at the N terminus, the conserved glycosylation site near the N terminus of the mature protein, and the recognition sites for monoclonal antibodies for sites A and D. Underlined or above-lined regions indicate the tryptic peptides identified by electrospray ionization (ESI)-mass spectrometry (MS; Supplemental Table S1, http://www.plantphysiol.org).

