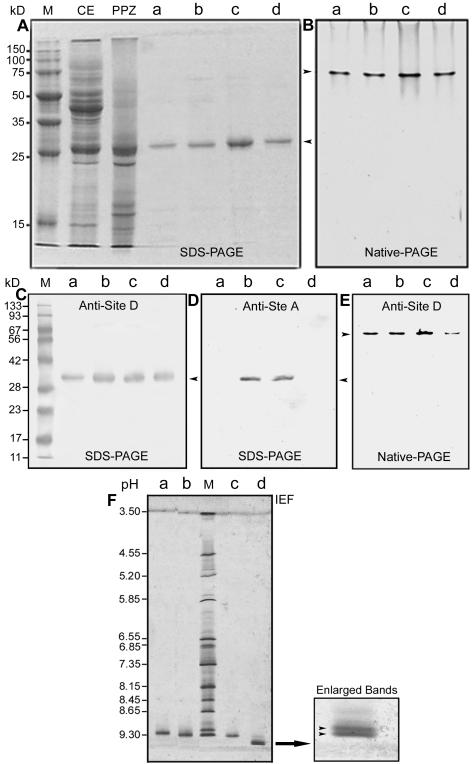
Figure 4.
Electrophoretic and immunoblot analysis of Zea m 1 from the different purification steps. A, Coomassie-stained SDS-PAGE. Lane M, Protein markers; lane CE, crude extract (40 μg); lane PPZ, partially purified Zea m 1 (20 μg) pooled from peaks I to III of the CM-Sepharose column; lanes a-d, Zea m 1a to d (approximately 2 μg lane-1) purified from the CM-HPLC column. B, Coomassie-stained native PAGE. Lanes a to d were loaded with 2 μg of purified Zea m 1a to d, respectively. Arrows indicate the position of Zea m 1 proteins. C, Immunoblot analysis of the Zea m 1a to d separated by SDS-PAGE and probed with McAb antisite D. D, Immunoblot analysis of Zea m 1a to d separated by SDS-PAGE and probed with McAb antisite A. E, Immunoblot analysis of Zea m 1a to d separated by native gel electrophoresis and probed with McAb antisite D. F, Isoelectric focusing (IEF) of Zea m 1a to d. Lane M, pI markers; lanes a to d, purified Zea m 1a to d (approximately 2 μg/lane), respectively. An enlargement of the Zea m 1d band is shown at the right.

