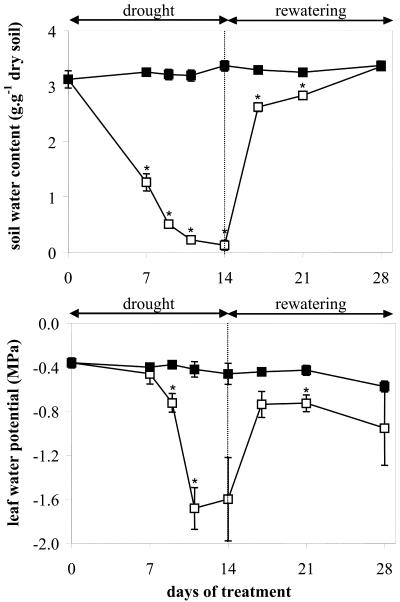
Figure 2.
Time courses of soil water content and leaf water potential in samples that were either well watered (control, black squares) or subjected to 14 d of drought followed by rewatering (drought-stressed, white squares). Vertical bars represent ± se (n = 3). The asterisk indicates significant differences between control and drought-stressed samples at P < 0.05.

