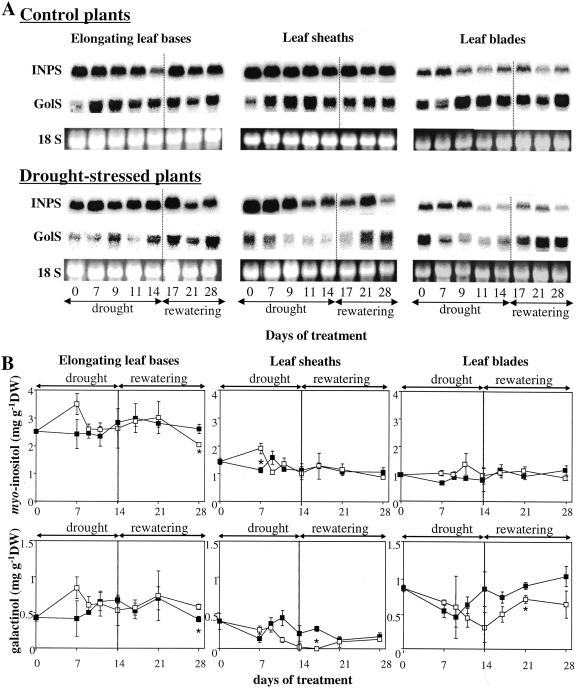
Figure 6.
Northern-blot analysis of INPS and GolS gene expression (A) and concentrations of myoinositol and galactinol (B) in the leaf tissues of perennial ryegrass plants that were either well watered (control, black squares) or subjected to 14 d of drought followed by rewatering (drought-stressed, white squares). A, Twenty micrograms of total RNA per lane was fractionated on a denaturing agarose gel, blotted to a nylon membrane, and hybridized with32P-labeled INPS and GolS cDNA probe, respectively. Loading of an equal amount of total RNA in each lane was verified by UV fluorescence of ethidium bromide-stained gel (the band corresponding to 18S rRNA was shown). B, Vertical bars represent ± se (n = 3). The asterisk indicates significant differences between control and drought-stressed samples at P < 0.05.

