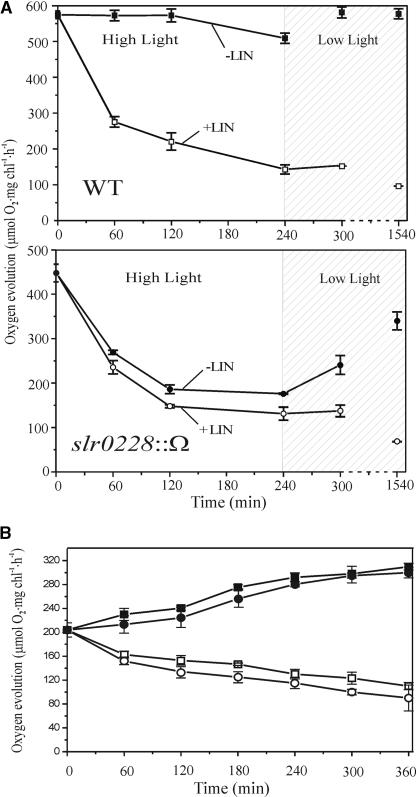
Figure 2.
Effect of Light on Oxygen Evolution from Whole Cells of Synechocystis Wild Type and slr0228::Ω.
Cells at a chlorophyll concentration of 20 μg/mL were exposed to either high light (1000 μE·m−2·s−1) (A) or low light (100 μE·m−2·s−1) (B) in the absence (closed symbols) or presence (open symbols) of lincomycin (100 μg/mL). The hatched area in (A) represents the recovery period under light growth conditions of 10 μE·m−2·s−1. WT, wild type. In (B), the wild-type data are indicated by squares and the data for the slr0228::Ω mutant are indicated by circles. Averages of two measurements of the same sample are plotted. Error bars indicate the range between the two values. Oxygen evolution was assayed in the presence of ferricyanide (1 mM) and 2,5-dimethylbenzoquinone (1 mM).

