Figure 1.
Structures of the T-DNA Regions of Vectors and Plant Lines.
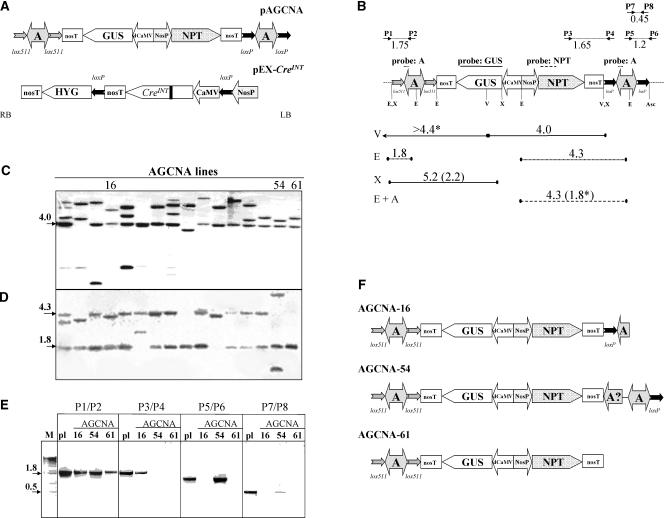
(A) The right and left borders of the T-DNA are indicated with RB and LB, respectively. Promoters are indicated by large arrows that indicate the direction of transcription; coding sequences are indicated by pointed boxes. All genes contain the nos polyadenylation region (nosT). The chromatin boundary A elements are indicated by two-headed arrows. The neomycin phosphotransferase selectable marker gene (NPT) is driven by the nos promoter (NosP). The β-glucuronidase gene (GUS) is driven by the d35S promoter of CaMV (dCaMV). The chromatin boundary element is the chicken lysozyme MAR, known as the A element (A). The pairs of lox sites around the A elements are indicated by small arrows that indicate the orientation of the lox sites. The creINT gene is under the control of the single (i.e., not enhanced) 35S promoter of CaMV. The black bar in the Cre coding sequence indicates the introduced plant intron. After self-excision of 35S-creINT, the hygromycin phosphotransferase selectable marker gene (HYG) will be driven by the nos promoter (NosP).
(B) Structure of the AGCNA T-DNA (as in [A]) with the positions of the restriction enzymes EcoRI (E), VspI (V), XhoI (X), and AscI (Asc) indicated. The fragments used as probes are indicated with lines above the T-DNA. The expected hybridizing fragments are given as lines below the T-DNA, with full lines for the GUS probe, dashed lines for the NPTII probe, and dotted lines for the A element probe. The sizes of the expected fragments are given in kb. The lengths of the expected fragments after the removal of the A elements are shown in parentheses (when different from those of the parent line). The border fragments consisting of T-DNA and flanking plant DNA are marked with asterisks, and the known size of the T-DNA fragment is given.
(C) Phosphorimage of the hybridization of VspI-digested DNA from the primary AGCNA transgenic plant population probed with GUS. The three lines chosen for further analysis are indicated.
(D) Phosphorimage of the hybridization of EcoRI-digested DNA probed with the A element.
(E) PCR analysis of AGCNA-16, -54, and -61 lines using four primer pairs to verify the intactness of the T-DNA integration. The lanes labeled pl contain a PCR fragment obtained on pAGCNA plasmid DNA as a positive control.
(F) In planta configuration of the T-DNA in lines AGCNA-16, -54, and -61 based on DNA gel blot analysis and PCR.

