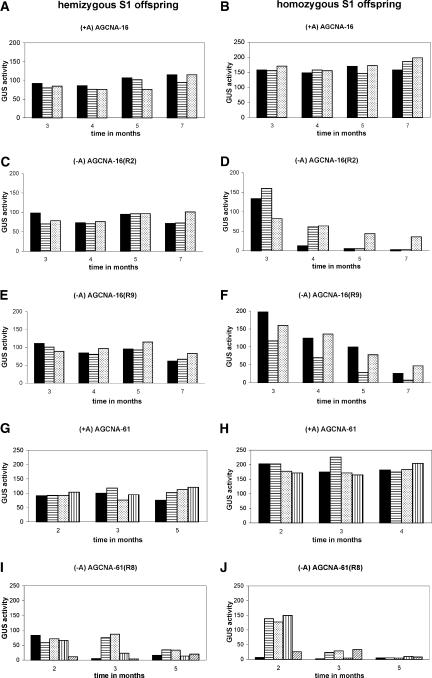
Figure 3.
Removal of the A Element Triggers Severe GUS Gene Silencing in S1 Offspring Plants.
The panels at the left give data for the hemizygous offspring, and the panels at the right give data for the corresponding homozygous offspring. Each bar gives the GUS activity of an individual plant. All retransformed offspring were selected for the physical absence of the EX-creINT locus.
(A) and (B) GUS activity in AGCNA-16 (+A).
(C) and (D) GUS activity in retransformed AGCNA-16(R2) (−A).
(E) and (F) GUS activity in retransformed AGCNA-16(R9) (−A).
(G) and (H) GUS activity in AGCNA-61 (+A).
(I) and (J) GUS activity in AGCNA-61(R8).

