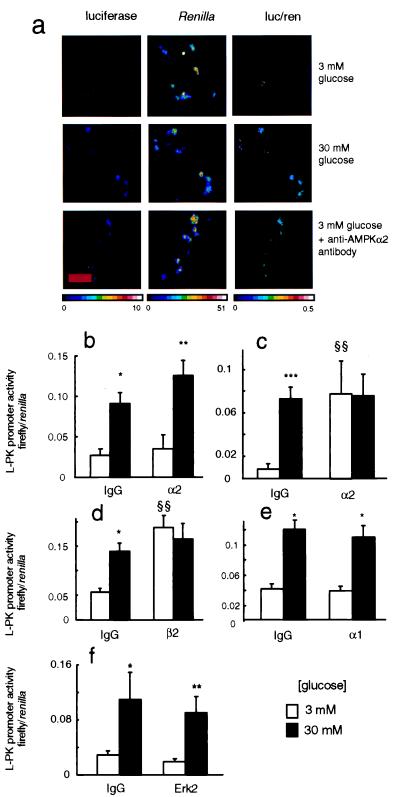
Figure 3.
Effect of anti-AMPK antibody injection on regulation of L-PK promoter by glucose. (a) MIN6 cells were microinjected with plasmids LPK.LucFF and pCMV.RL as detailed in Fig. 2, plus either preimmune IgG or anti-AMPK-α2 IgG (1.0 mg⋅ml−1 each) as shown. In all cases, cells were doubly injected into the cytosol and nucleus and cultured for 6 h at the indicated glucose concentrations before successive imaging of firefly and R. reniformis luciferase activities (see Experimental Procedures and ref. 38). The intensity of cell luminescence is given in pseudocolor (photon⋅pixel−1⋅s−1). The relative activity of the L-PK vs. cytomegalovirus promoters in individual cells is indicated in the ratiometric images (firefly/R. reniformis luciferase activities) which were calculated by using photek software. (Bar = 50 μm.) (b) Effect of nucleus-only injection of anti-α2-antibodies. (c) Same as b, but with nucleus plus cytosolic injection. (d) Same as c, but with anti-AMPK β2 antibodies. (e) Same as c, using anti-AMPK α1-IgG. (f) Same as c, using anti-Erk2 (p42 MAPK) antibodies. Data from three to five separate experiments, with 20–90 productively injected cells per condition. *, P < 0.05; **, P < 0.01; ***, P < 0.001 for the effect of 30 vs. 3 mM glucose; §§, P < 0.01 for the effect of anti-AMPK antibodies.

