
Figure 4.
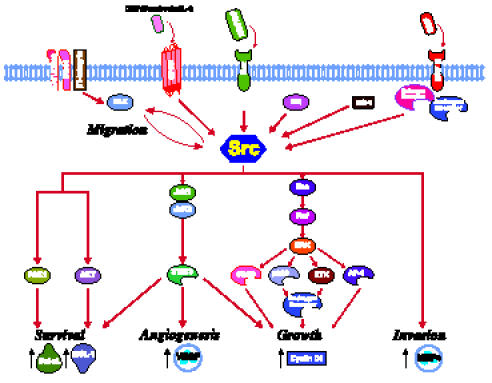
Known Src pathways in prostate cancer. The close proximity of molecules not connected with arrows denote physical association. Red arrows denote activation. Black arrows denote change in levels of molecule. Figure templates were provided by BioCarta (San Diego, CA).