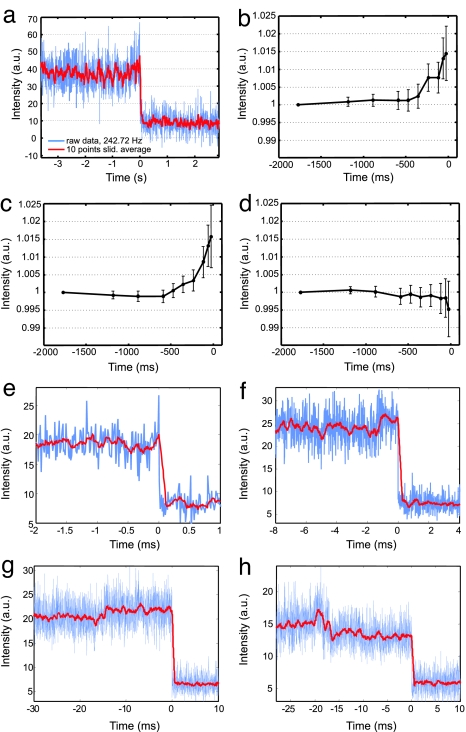
Fig. 4.
Single DNA cleavage events monitored by plasmon coupling. (a) Cleavage trajectory recorded at 240 Hz by using an intensified CCD detector. (b–d) Average scattering intensities at defined intervals preceding the dimer dissociation (0 ms) for 30 (b), 40 (c), and 60 (d) bp plasmon rulers (raw data recorded at 85 Hz). We set the time of the plasmon ruler dissociation equal to 0 ms and calculated average intensities for shortening time intervals between [−1,770 to 0] and [−24 to 0] ms. To account for different starting intensities, we normalized the trajectories and set the average intensities of the longest time interval equal to one for each trajectory [total number of trajectories: 86 (30 bp), 96 (40 bp), and 114 (60 bp)]. Error bars indicate standard errors of the mean. Increasing scattering intensities for 30- and 40-bp spacers are consistent with a decreasing interparticle distance due to bending in the enzyme–DNA complex. For the 60-bp spacers, the plasmon coupling is too weak to observe the bending (see text). The slight drop in the last data point of d is due to some uncertainty in defining the moment of dissociation. In some trajectories, points during or shortly after the dissociation were picked, leading to an overall lower scattering intensity. (e–h) Individual scattering trajectories for 40-bp plasmon rulers recorded at 85 Hz. The raw data are plotted in blue; sliding averages [over 10 (e), 25 (f), and 50 (g and h) frames] are included in red to guide the eye. A common feature observed in many trajectories is a slight increase in scattering intensity preceding dimer dissociation (0 s). The dwell times in the high-intensity state range from a few (e) to hundreds (f) of milliseconds to tens of seconds (g). (h) In ≈4% of the recorded trajectories, we first observed a slight drop in intensity before dimer dissociation. This result is consistent with subsequent cleavage event in plasmon rulers with multiple tethers.

