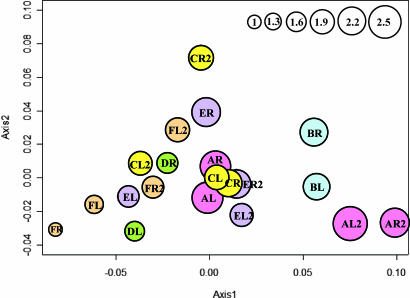
Fig. 4.
DPCoA of SLOTU relatedness in 20 forearm skin samples obtained from six subjects. Subjects were designated A–F, and at each sampling both left (L) and right (R) forearm skin was examined. In four subjects, new specimens were obtained 8–10 months later (e.g., designated FL2). In a representation of the first two orthogonal principal axes, based on a sample dissimilarity matrix, samples from the same subject at the same time point are plotted by using the same color, with circle size proportional to the sample's Rao diversity index. The scale (top right) indicates the relative diversity of circles, with the test sample of smallest diversity (FR) indexed as 1.0.

