
FIG. 6.
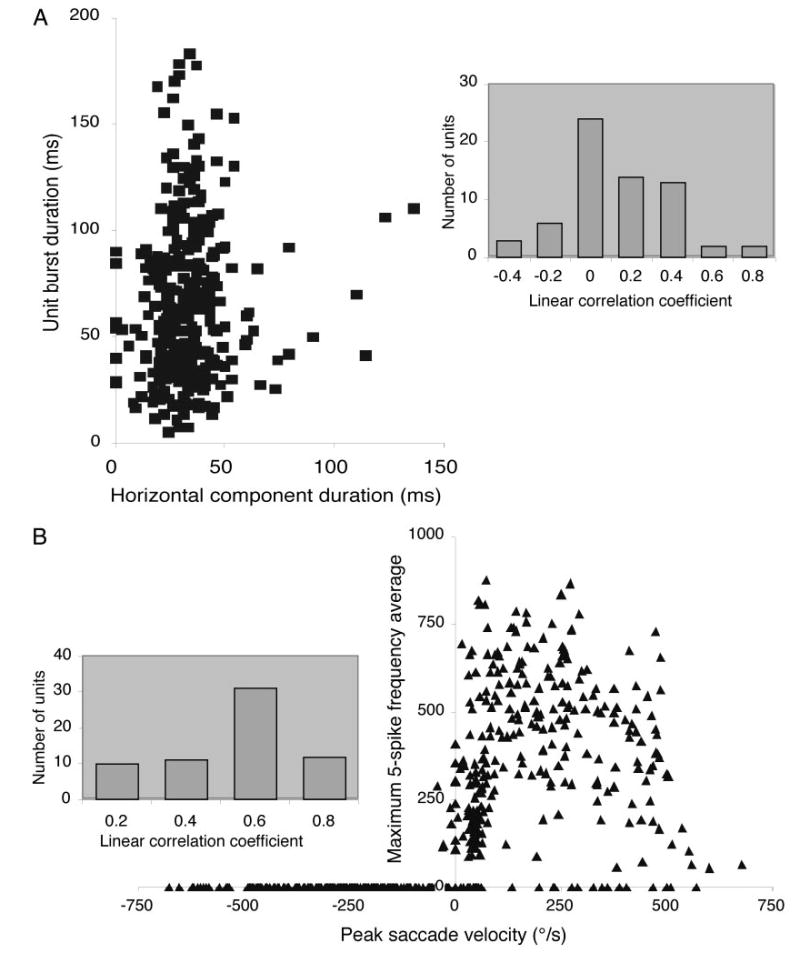
A: scatterplot of burst duration and saccade duration. B: scatterplot of burst frequency and saccade velocity. Insets: distribution of correlation coefficients for the population of dLLBNs.
Official websites use .gov
A
.gov website belongs to an official
government organization in the United States.
Secure .gov websites use HTTPS
A lock (
) or https:// means you've safely
connected to the .gov website. Share sensitive
information only on official, secure websites.
A: scatterplot of burst duration and saccade duration. B: scatterplot of burst frequency and saccade velocity. Insets: distribution of correlation coefficients for the population of dLLBNs.