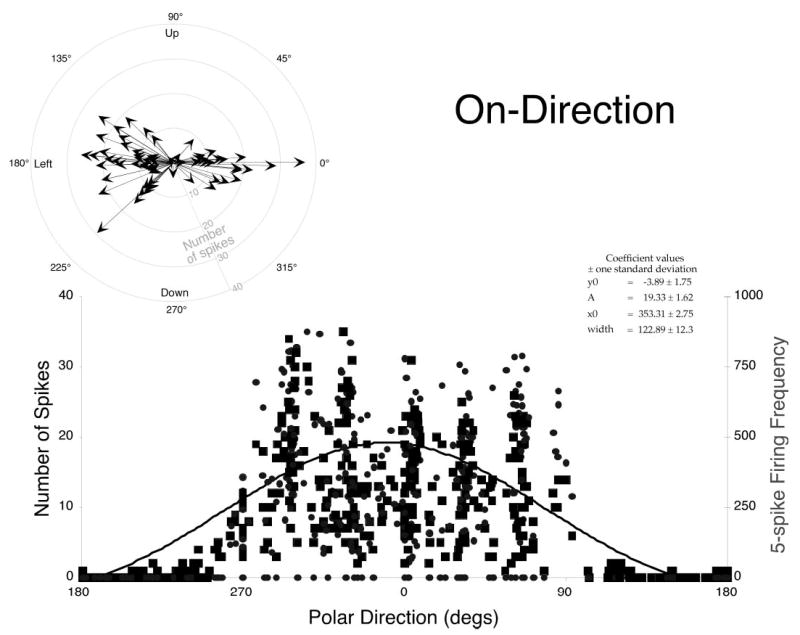
FIG. 7.

ON-Directions of dLLBNs. Plots of number of spikes (dark squares) or firing frequency (gray triangles) as a function of the polar direction of the associated saccade (0° = right, 90° = up, etc.) were fit with a Gaussian curve (inset) as described in text. Polar plot (top left) summarizes optimal direction (ON-direction) for each dLLBN. Length of arrow indicates peak discharge (gray scale). All dLLBNs had ipsilateral ON-directions (either left or right).
