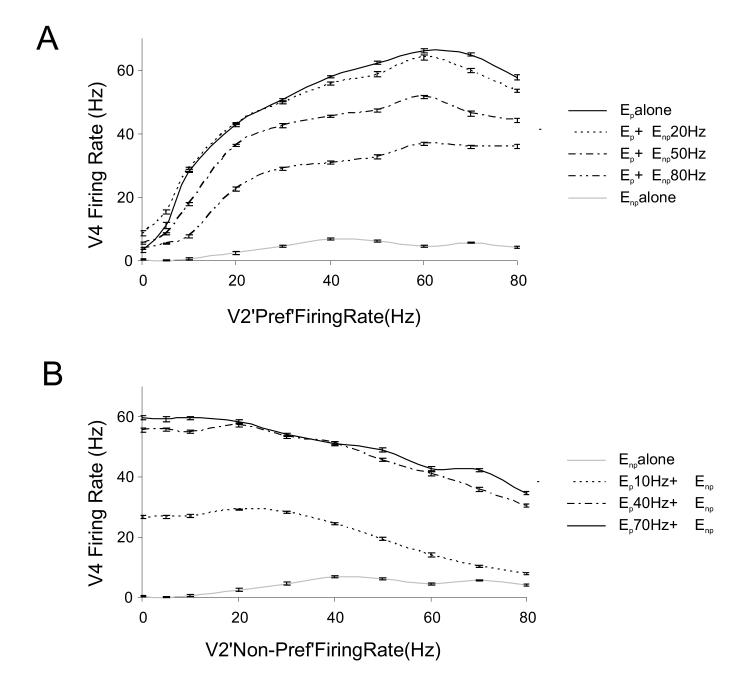
Figure 6.
Average response of the modeled V4 neuron response as a function of firing rate (contrast) combinations of the preferred and non-preferred synaptic input.
(A) Average firing rate of the V4 neuron during the stimulation period to the preferred stimulus combined with different firing rate (contrasts) inputs from the non-preferred stimulus. Solid black line represents response to preferred stimulus alone i.e. when synaptic input was provided only through the Ep population. The response to the combination of preferred Ep and non-preferred stimulus population Enp active at 20 Hz nearly overlaps the response to preferred stimulus alone (dashed line). Response to preferred stimulus input is successively suppressed when combined with non-preferred stimulus and is most suppressed when non-preferred inputs fire at 80 Hz (double dot dashed line). Response to the non-preferred stimulus input (Enp) active alone is shown in light gray.
(B) Average firing rate response of the modeled neuron to the non-preferred stimulus input combined with different firing rate (contrasts) inputs from the preferred stimulus. Light gray line represents response to Enp active alone. The dashed black line represents the Enp activity combined with 10 Hz of preferred stimulus input (Ep) activity. Enp combined with more prominent Ep activity of 40 Hz (dot dashed line) or 70 Hz (solid black line). Error bars represent standard error.

